As part of the StateTrust investment and portfolio management process, we take your individual circumstances into account in order to provide effective advice. Together, we will work to define your financial goals, determine your investment allocation strategy, choose the right financial vehicles, find the appropriate money managers, and create a portfolio designed to meet your financial goals. This graphic shows risk and return tradeoffs for different combinations of cash, bonds, and stocks (period 1969-2010). While a higher allocation of stocks and bonds in a portfolio leads to a higher return, it also involves a greater amount of risk.
 |
 |
||||||||||
|
|
Source: Federal Reserve database in St. Louis (FRED). Performance shown is not indicative of the performance of any specific investment. An investor cannot invest in an index, such as the one these graphs are based on. Past returns are no guarantee of future performance. These returns are based on historical information, from sources believed to be reliable, but accuracy cannot be guaranteed, and these returns can vary in future time periods.
Portfolio Design
Creating a sound portfolio, one that encompasses the right mix of assets to suit your financial needs and tolerance for risk, is part of our core expertise. We seek to diversify your holdings*, as well as to meet the appropriate risk/return objective. Our process provides for periodic readjustments of your portfolio in response to changing economic or business conditions.
Developing and managing our clients' portfolios to meet their goals and risk profile is a top priority at StateTrust. Our consultants and advisers have the necessary expertise to assess you in portfolio management decisions such as Equity Style Management and Portfolio Design. We invest a lot of time, effort, and energy into researching and selecting the right money managers to oversee your holdings.
Our advisers will guide you in selecting the right asset allocation by explaining the risk/reward characteristics of each of the following asset classes:
- Stocks by region (US, Asia, Europe, Emerging Markets).
- Stocks by style (Large-Cap, Mid-Cap, Small-Cap): Growth/Value.
- Bonds (Sovereign, Corporate, Municipal, Asset Backed, Emerging Markets).
- Cash.
- Real Estate.
- Alternative Investments.
* Diversification does not guarantee a profit or ensure against loss.
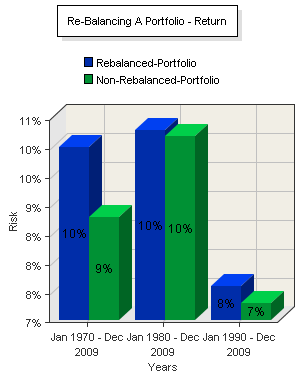
Re-Balancing a Portfolio
At StateTrust we view re-balancing as a means to manage the client's risk/investment profile.
Re-balancing is critical in keeping the portfolio within the risk tolerance level that is comfortable for the investor's asset-allocation strategy.
<!--The graphic below compares the risk and return of portfolios that are rebalanced to those that are not rebalanced over three different time periods.
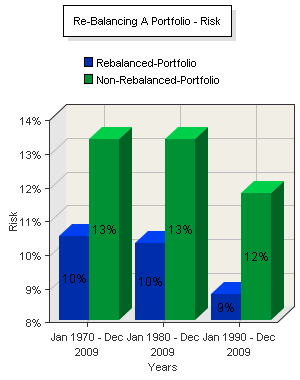
 Source: StateTrust’s analysis of Morningstar data. Performance shown is not indicative of the performance of any specific investment. An investor cannot invest in an index, such as the one these graphs are based on. Past returns are no guarantee of future performance. These returns are based on historical information, from sources believed to be reliable, but accuracy cannot be guaranteed, and these returns can vary in future time periods.-->
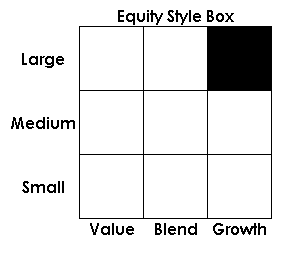
Equity Style Management/Benchmarks
Different investment styles emerged back in the early 1980s. Equity style describes how stocks are grouped into different categories based on two factors: market capitalization and fundamental valuation. As can be seen from the equity style box below, this creates up to 9 different equity styles. Based on market capitalization, stocks will fall in one of three categories: small cap, mid cap, or large cap. Based on fundamental valuation characteristics, stocks will be grouped as either value, growth, or a blend of the two. Value stocks are characterized as having either a low P/E ratio, a low price to cash flow ratio, or a low price to book ratio in relation to the average stock. This is generally due to lower growth prospects. Conversely, growth stocks have high growth prospects and as a result tend to have a higher than average P/E ratio, price to cash flow ratio, or price to book ratio.
Equity style benchmarks are used to measure the portfolio manager's performance as well as his or her ability to increase the value of the portfolio. The benchmark gives a number to measure against, and provides an indication of how the fund is doing. This comparison helps determine if a fund is underperforming or overperforming.
There are three basic style benchmarks:
- Normal portfolio: Representation of a stock universe that would be considered “normal” for inclusion in the fund manager's portfolio.
- Style Index: This is an average of a selection of style indexes.
- Style universe median: Benchmark produced by investment companies who track managers in equity style categories. The fund manager will then be compared to his or her peers.
Capitalization or “cap” for short, is the market value of a company's stock and gives a picture of the company's size. Stock price alone does not determine how large or how small a company is. The market capitalization value is calculated by multiplying a company's outstanding shares (those held by the public) by the share price. By classifying companies into their capitalization levels, investors and fund managers can determine growth potential.
| Large-Cap |
|---|
| Companies with a market capitalization higher than $10 billion |
| Large, well-known companies like IBM; often referred to as "blue-chip Stocks" |
| Lower risk |
| Traded in large exchanges like the New York Stock Exchange |
| Mid-Cap |
|---|
| Companies with a market capitalization between $1 billion and $10 billion |
| More volatile than large cap companies |
| Traded mostly in large exchanges like the New York Stock Exchange |
| Small-Cap |
|---|
| Companies with a market capitalization less than $1 billion |
| Usually comprised of newer companies |
| Less stable than either large or mid caps and thus are generally considered higher risk investments |
There is no unique way to investing and creating portfolios. Our job is to create the right portfolio for your specific investment goals and objectives. Together, we will work to:
- Define Your Investment Parameters.
- Select the Appropriate Investment Vehicles.
- Select an Appropriate Manager.
Investment Parameters
- Risk Tolerance.
- Time Horizon.
- Liquidity.
- Income Tax Considerations.
- Expected return on your investments.
- Systematic Risk.
- Unsystematic Risk.
- Minimum required rate of return.
- Actual Return.
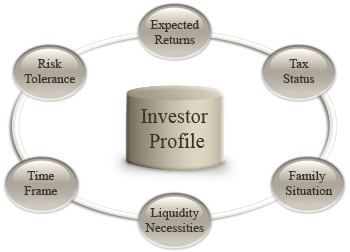
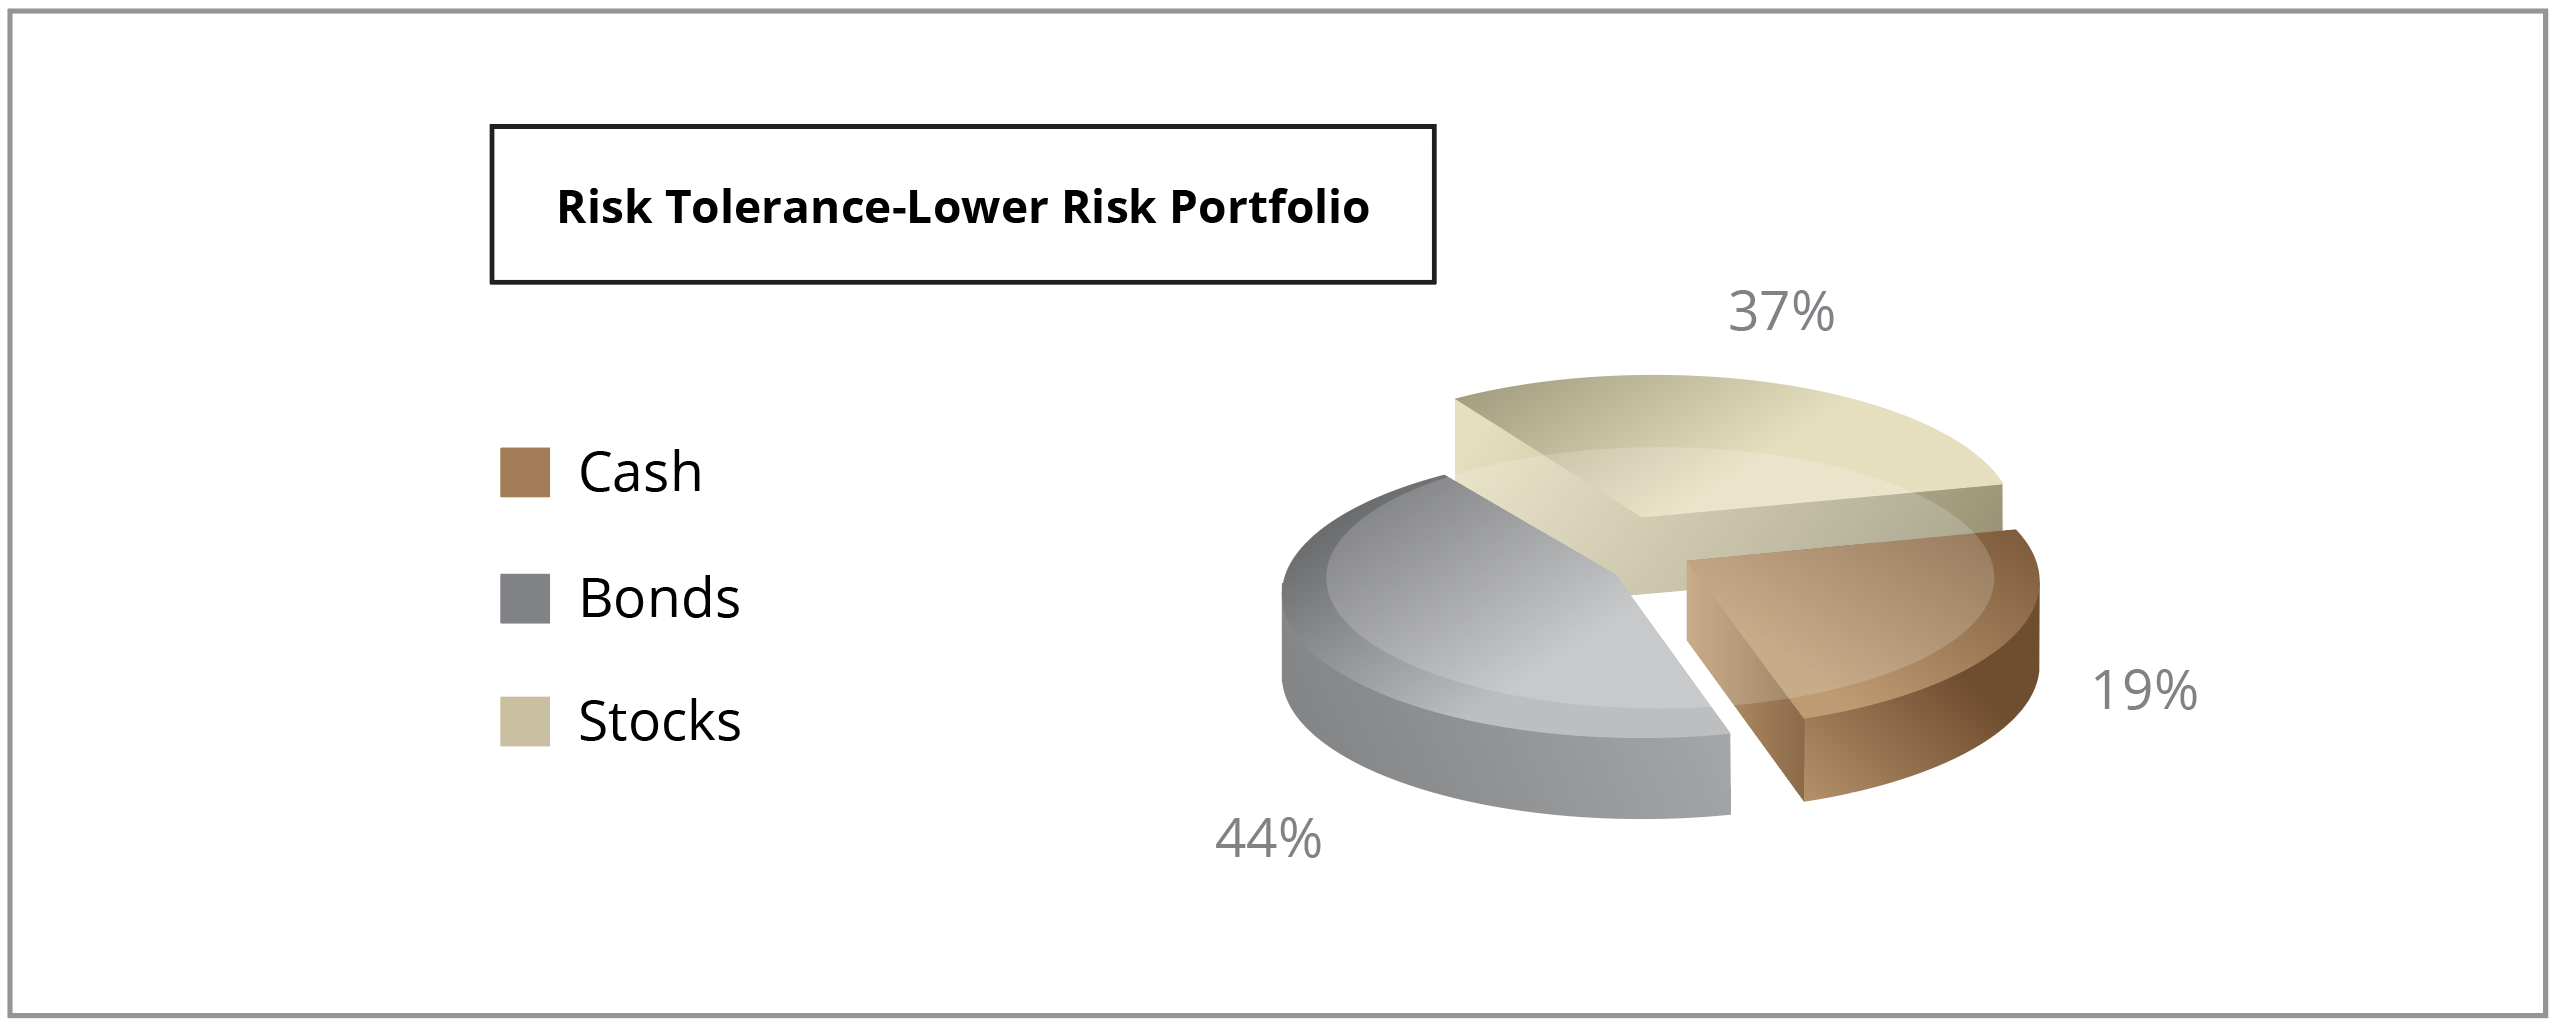
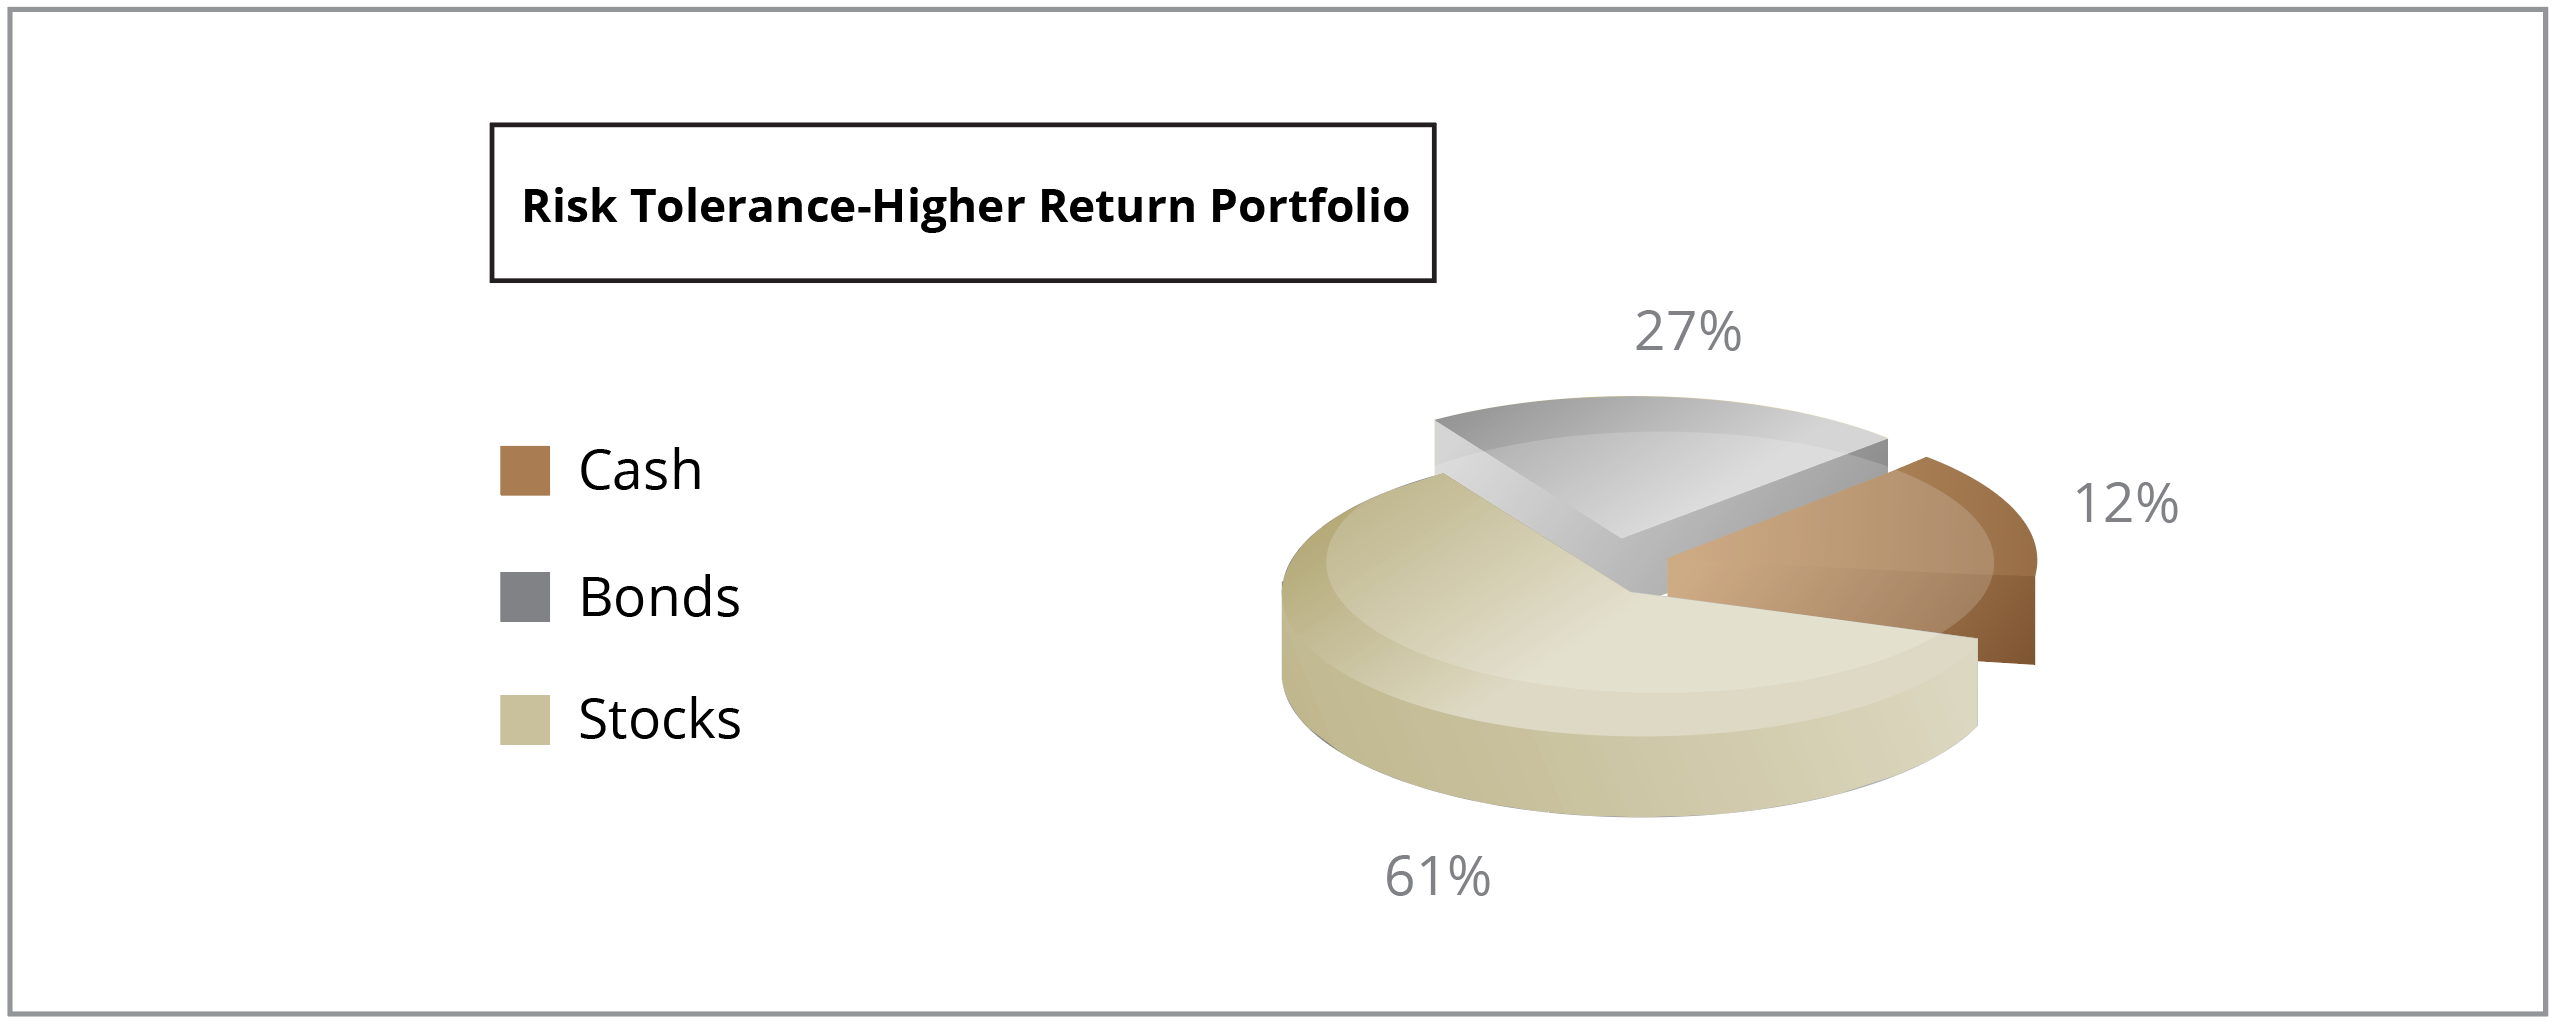
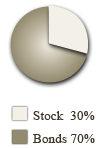
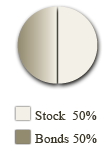
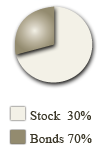
We can assess investment parameters and create your financial profile by looking at: Risk tolerance level/Investment Parameter The amount of risk you are willing to take as an investor. Generally, higher returns imply a higher amount of risk (expressed by the standard deviation) as can be seen in the table below.
| Conservative | Moderate | Balanced | Growth | Agressive Growth | |
| Historical Return* (%) | 6.9 | 7.9 | 8.5 | 9.1 | 10.1 |
| Standard Deviation (%) | 10.58 | 12.32 | 13.48 | 14.64 | 23.79 |
| Target Allocation |  |
 |
 |
 |
 |
Source: Federal Reserve database in St. Louis (FRED) (1970-2018) Performance shown is not indicative of the performance of any specific investment. An investor cannot invest in an index, such as the one these graphs are based on. Past returns are no guarantee of future performance. These returns are based on historical information, from sources believed to be reliable, but accuracy cannot be guaranteed, and these returns can vary in future time periods.
Liquidity/Investment Parameter
If you may have a need to cash out a significant portion of your investments in a short time period, it is important that we look at your investment's ability to convert into cash at any point without having to sell the investment at a significant discount from its current market price.
Income Tax Considerations/Investment Parameter
Your investment selection can be influenced by your tax bracket, available tax credits, and amounts and types of income, deductions, and depreciation.
Expected Return on Your Investments/Investment Parameter
We can provide historical information of returns for different asset classes. Since past performance does not guarantee future performance, the difference between historical returns and actual returns could be significant.
Systematic Risk/Investment Parameter
Systematic Risk is the risk you cannot reduce or eliminate.
- Inflation.
- Marketplace.
- Interest rate.
- Politics and regulations.
Unsystematic Risk/Investment Parameter
Company-specific or industry-specific risk in a portfolio. It can be significantly reduced/eliminated through diversification*.
Minimum Required Rate of Return/Investment Parameter
The amount of return necessary to warrant a purchase. Your financial objectives will define this minimum rate.
Actual Return-/Investment Parameter
The return that an investor accrued on any particular investment or set of investments in a period of time. The calculation takes into account interest, dividends, the investment's price appreciation, and the time the investment was held.
Selecting Appropriate Investment Vehicles
Asset allocation (the process of distributing your portfolio over various asset classes) is widely recognized as the principal reason for a portfolio's return variations. It is critical to determine an asset allocation strategy with the client's goals and objectives in mind, balanced against the client's risk tolerance.
Part of the job of asset allocation is to stabilize returns through diversification*.
* Diversification does not guarantee a profit or ensure against loss.
We can assess investment parameters and create your financial profile by looking at: Risk tolerance level/Investment Parameter The amount of risk you are willing to take as an investor. Generally, higher returns imply a higher amount of risk (expressed by the standard deviation) as can be seen in the table below.
| Conservative | Moderate | Balanced | Growth | Agressive Growth | |
| Historical Return* (%) | 6.9 | 7.9 | 8.5 | 9.1 | 10.1 |
| Standard Deviation (%) | 10.58 | 12.32 | 13.48 | 14.64 | 23.79 |
| Target Allocation | 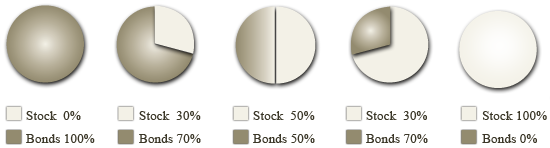 |
||||
Source: Federal Reserve database in St. Louis (FRED) (1970-2018). Performance shown is not indicative of the performance of any specific investment. An investor cannot invest in an index, such as the one these graphs are based on. Past returns are no guarantee of future performance. These returns are based on historical information, from sources believed to be reliable, but accuracy cannot be guaranteed, and these returns can vary in future time periods.
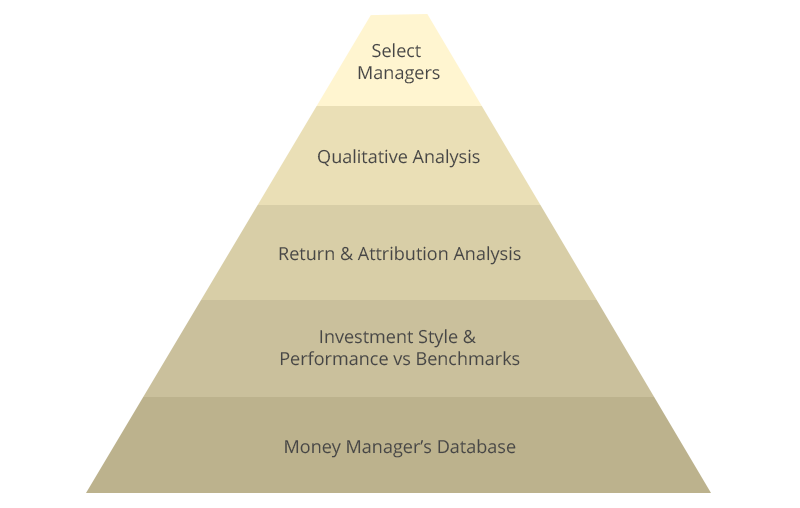
Selecting the Appropriate Manager
Pool of Managers:
StateTrust supports a large database of the world's most qualified managers across more than 20 asset classes. Managers from a pool of 500 are categorized according to their investment style and performance is measured against 100 specialized benchmarks.
To obtain the highest probability of superior returns, historical performance is analyzed under different market conditions with emphasis on risk adjusted returns. Once this quantitative analysis is conducted, as a client, you will have direct contact with the prospected manager.