At StateTrust we understand Global Asset Allocation as the process of building a diversified investment portfolio* by combining different asset classes such as equities, fixed income, commodities, alternative investments, and cash. Some factors that influence the asset-allocation decision are: client objectives, investment horizon, and risk profile.
Every asset class may perform differently in response to market changes. Thus, determining which asset classes clients should hold and its appropriate allocation and correlation to each other represents an important decision in meeting client's risk-adjusted return expectations.
The image below exemplifies different stock and bond asset allocations and corresponding returns and risks. StateTrust has accumulated a wealth of experience building diversified global portfolios*.
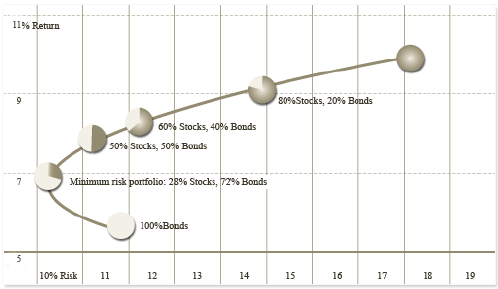
Source: StateTrust’s analysis of Morningstar data. Performance shown is not indicative of the performance of any specific investment. An investor cannot invest in an index, such as the one these graphs are based on. Past returns are no guarantee of future performance. These returns are based on historical information, from sources believed to be reliable, but accuracy cannot be guaranteed, and these returns can vary in future time periods.
* Diversification does not guarantee a profit or ensure against loss.
Current Asset Allocation
Asset allocation is the most important determination of your portfolio's long-term performance. StateTrust analyzes your holdings in detail, and evaluates your holding's exposure to different asset classes and whether your investment managers are adhering to their stated asset allocation strategies. Investment styles also tell us which peer groups your managers belong to and can be measured against.
Domestic Equity: Managers are categorized by the characteristics of the securities in their investment portfolio.
- Value: Purchase of securities that are out of favor (low P/E or price to cash flow) or inefficiently priced.
- Core: Imitation of the S&P 500 with fewer securities.
- Growth: Purchase of securities with growth rates expected to be higher than overall stock market.
Money managers are separated in each of these equity styles according to how they choose securities:
- Top-down: Analysis begins with a macro examination of the global markets.
- Bottom-up: Securities match specific characteristics such as a range of P/E ratios.
- Concentrator: The focus is on a few securities or just a few sectors of the market.
Domestic Fixed Income: Managers can choose to manage a bond portfolio or add value through:
- Changing the average credit quality.
- Switching among different sectors.
- Altering the average maturity/duration.
- Arranging trading spreads.
Broad Asset Classes
Broad asset classes can usually be broken down into several sub-asset classes. StateTrust investment advisors will help you decide which asset classes you should have in your portfolio based on your financial goals, time horizon, and risk tolerance levels. Below is a sample utilized by StateTrust investment advisors:
- Large Cap Equity: Equity securities with capitalization over $10 billion, mostly matching those in the Standard & Poor's 500 Index.
- Small Capitalization: Managers invest in companies with an average market capitalization of about $400 million (securities will have capitalization under $1 billion).
- International Equity: Includes about 1,000 securities from stock exchanges in Europe, Australia, New Zealand, and the Far East.
- Broad Domestic Fixed-Income An amalgamation of all publicly issued, fixed-rate, nonconvertible, domestic bonds. On average, BBB rated, with a minimum outstanding principal of $100 million for U.S. government issues or $50 million for other bonds. Maturity of at least one year.
- Defensive Domestic Fixed-Income Fixed-income securities with an average maturity of two to five years.
- International Fixed-Income Salomon Brothers Non-U.S. Dollar World Government Bond Index (capitalization-weighted). Includes all fixed-rate government bonds in 10 countries with remaining maturities of a year or longer with outstanding amounts of at least the equivalent of $100 million U.S. dollars.
- Cash Equivalents Money market funds, Treasury bills and other investments characterized by high liquidity, along with a known market value and a maturity of less than three months.
- Real Estate Mixed open/closed-end funds managed by real estate companies.
Duration
Duration is the current value of the bond's coupon payments/principal repayment. The higher the coupon payment and the nearer the principal repayment, then the lower the bond's duration. Portfolios based on fixed income with longer maturities typically have longer durations, which means more price volatility than those with lower durations.
Defensive: Portfolios feature short duration bonds, usually less than five years with a maturity of two to five years.
Intermediate: Portfolios feature bonds with a duration from three to ten years and maturity of four to ten years.
Active Duration: Managers adjust the duration to expected interest rate changes.
Extended Maturity: Portfolios feature bonds with a duration from 10 to 25 years and maturity of more than ten years.
Core: Duration mimics that of a broad market index.
High yield: Managers invest in fixed-income securities with ratings lower than investment-grade.
Mortgage-backed: The focus is on mortgage-backed securities.
Time Horizon
StateTrust client advisors are aware of the importance of a time horizon in a portfolio. It is a key element when choosing between stock and fixed-income investments.
The graph below shows the range of compound annual returns for stocks, bonds, and cash over one-, five-, and 20-year holding periods. During the worse 20-year holding period for stocks since 1926, stocks still posted a positive 20-year compound annual return. Although stockholders can expect more short-term volatility, the risk of holding stocks appears to diminish with time.
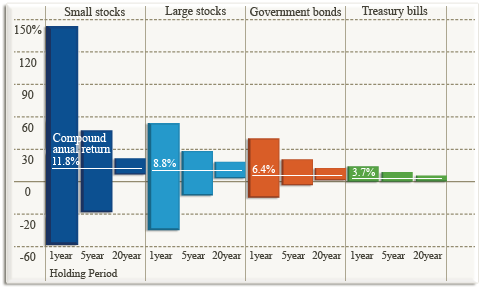
Source: StateTrust’s analysis of Morningstar data. Performance shown is not indicative of the performance of any specific investment. An investor cannot invest in an index, such as the one these graphs are based on. Past returns are no guarantee of future performance. These returns are based on historical information, from sources believed to be reliable, but accuracy cannot be guaranteed, and these returns can vary in future time periods.
Risk Tolerance
StateTrust client advisors allocate securities from different asset classes to client portfolios based in large part to the client's risk tolerance levels. Generally, to achieve higher returns, it is necessary to take more risk.
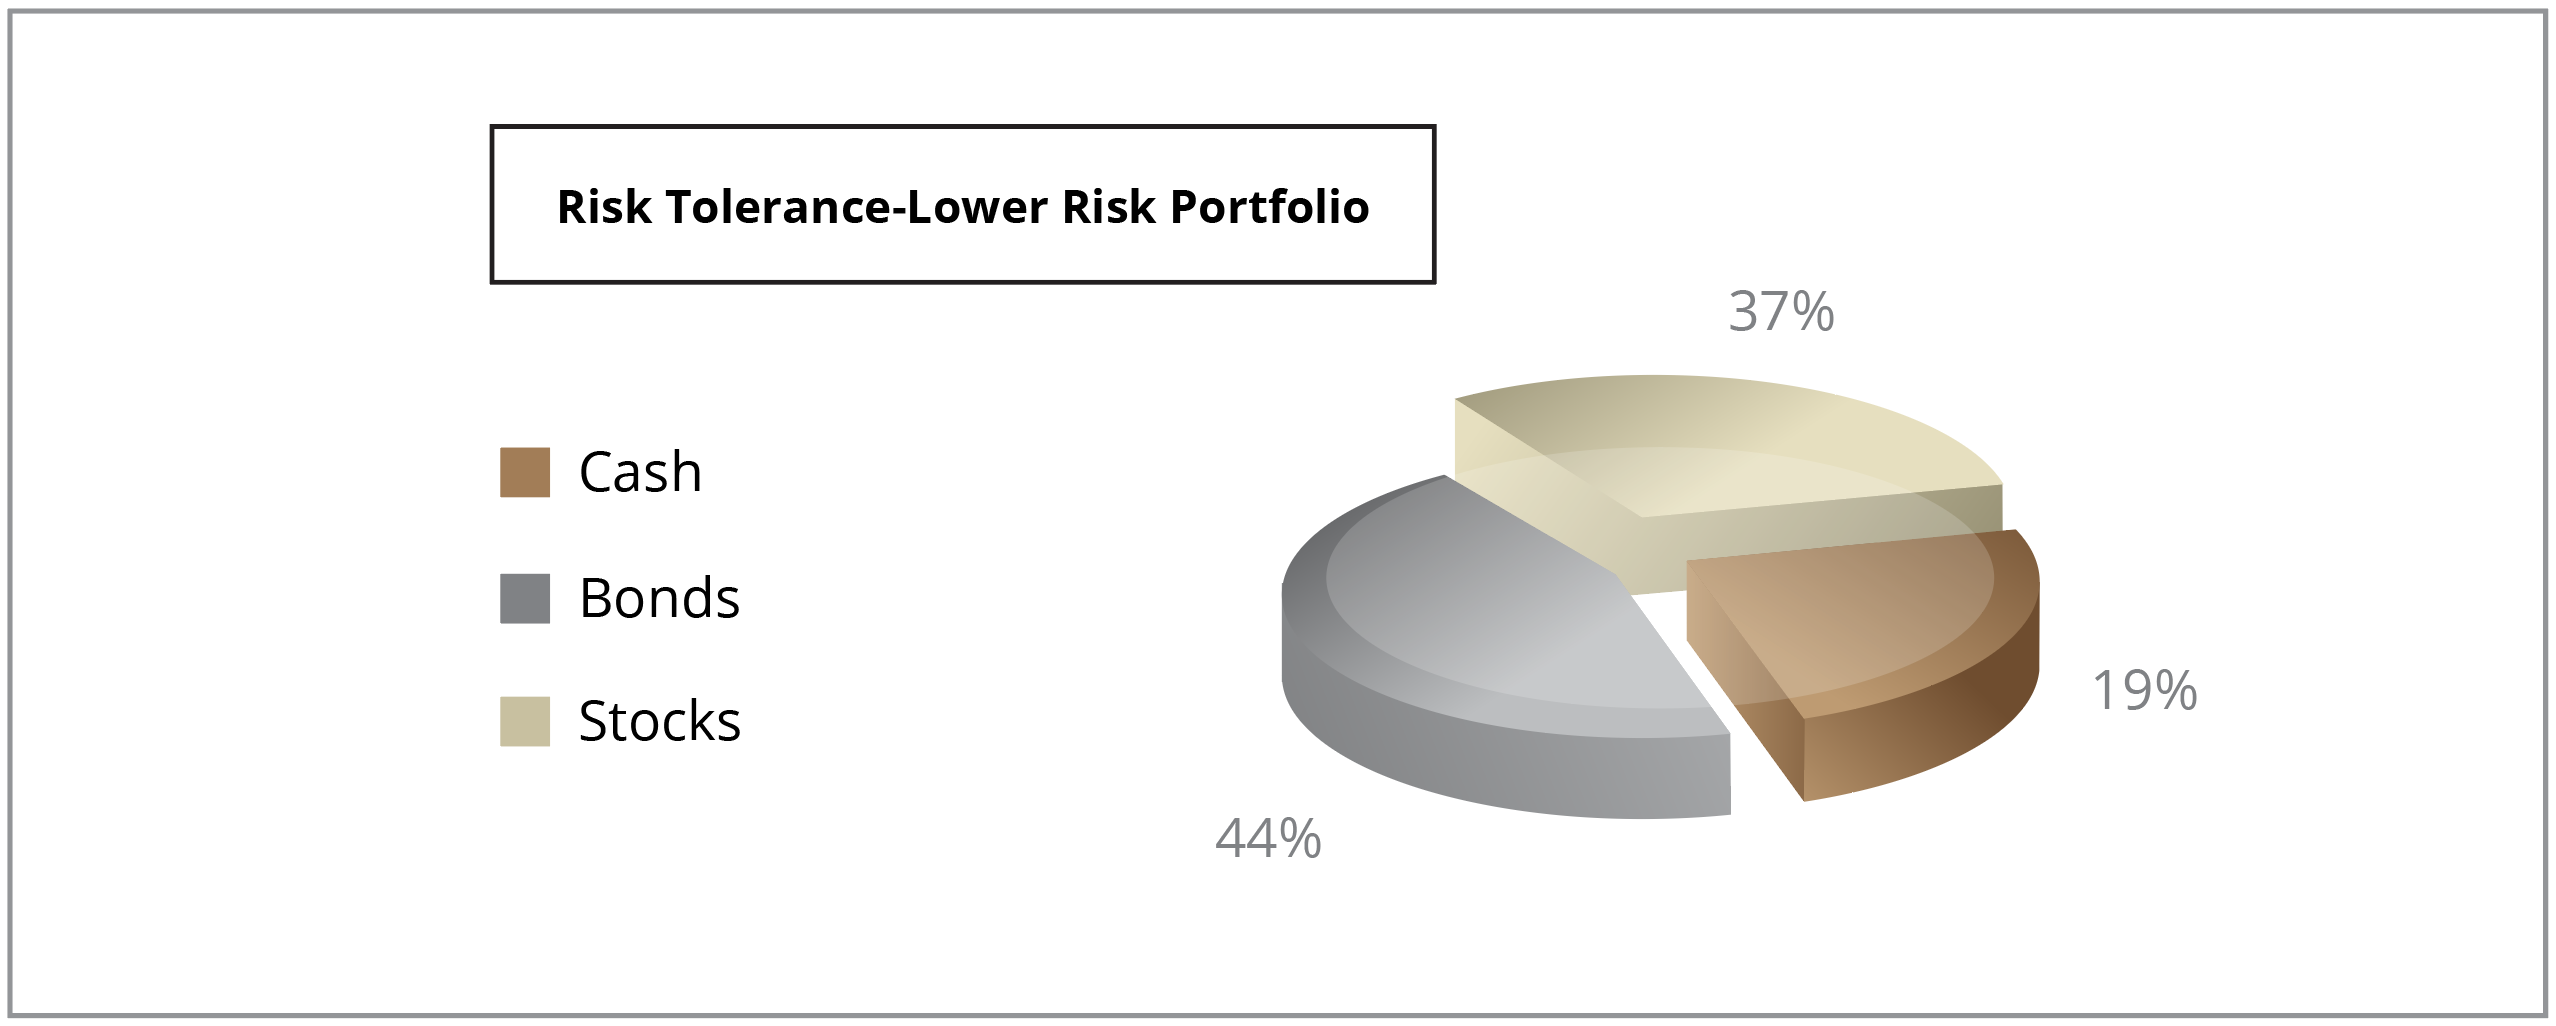
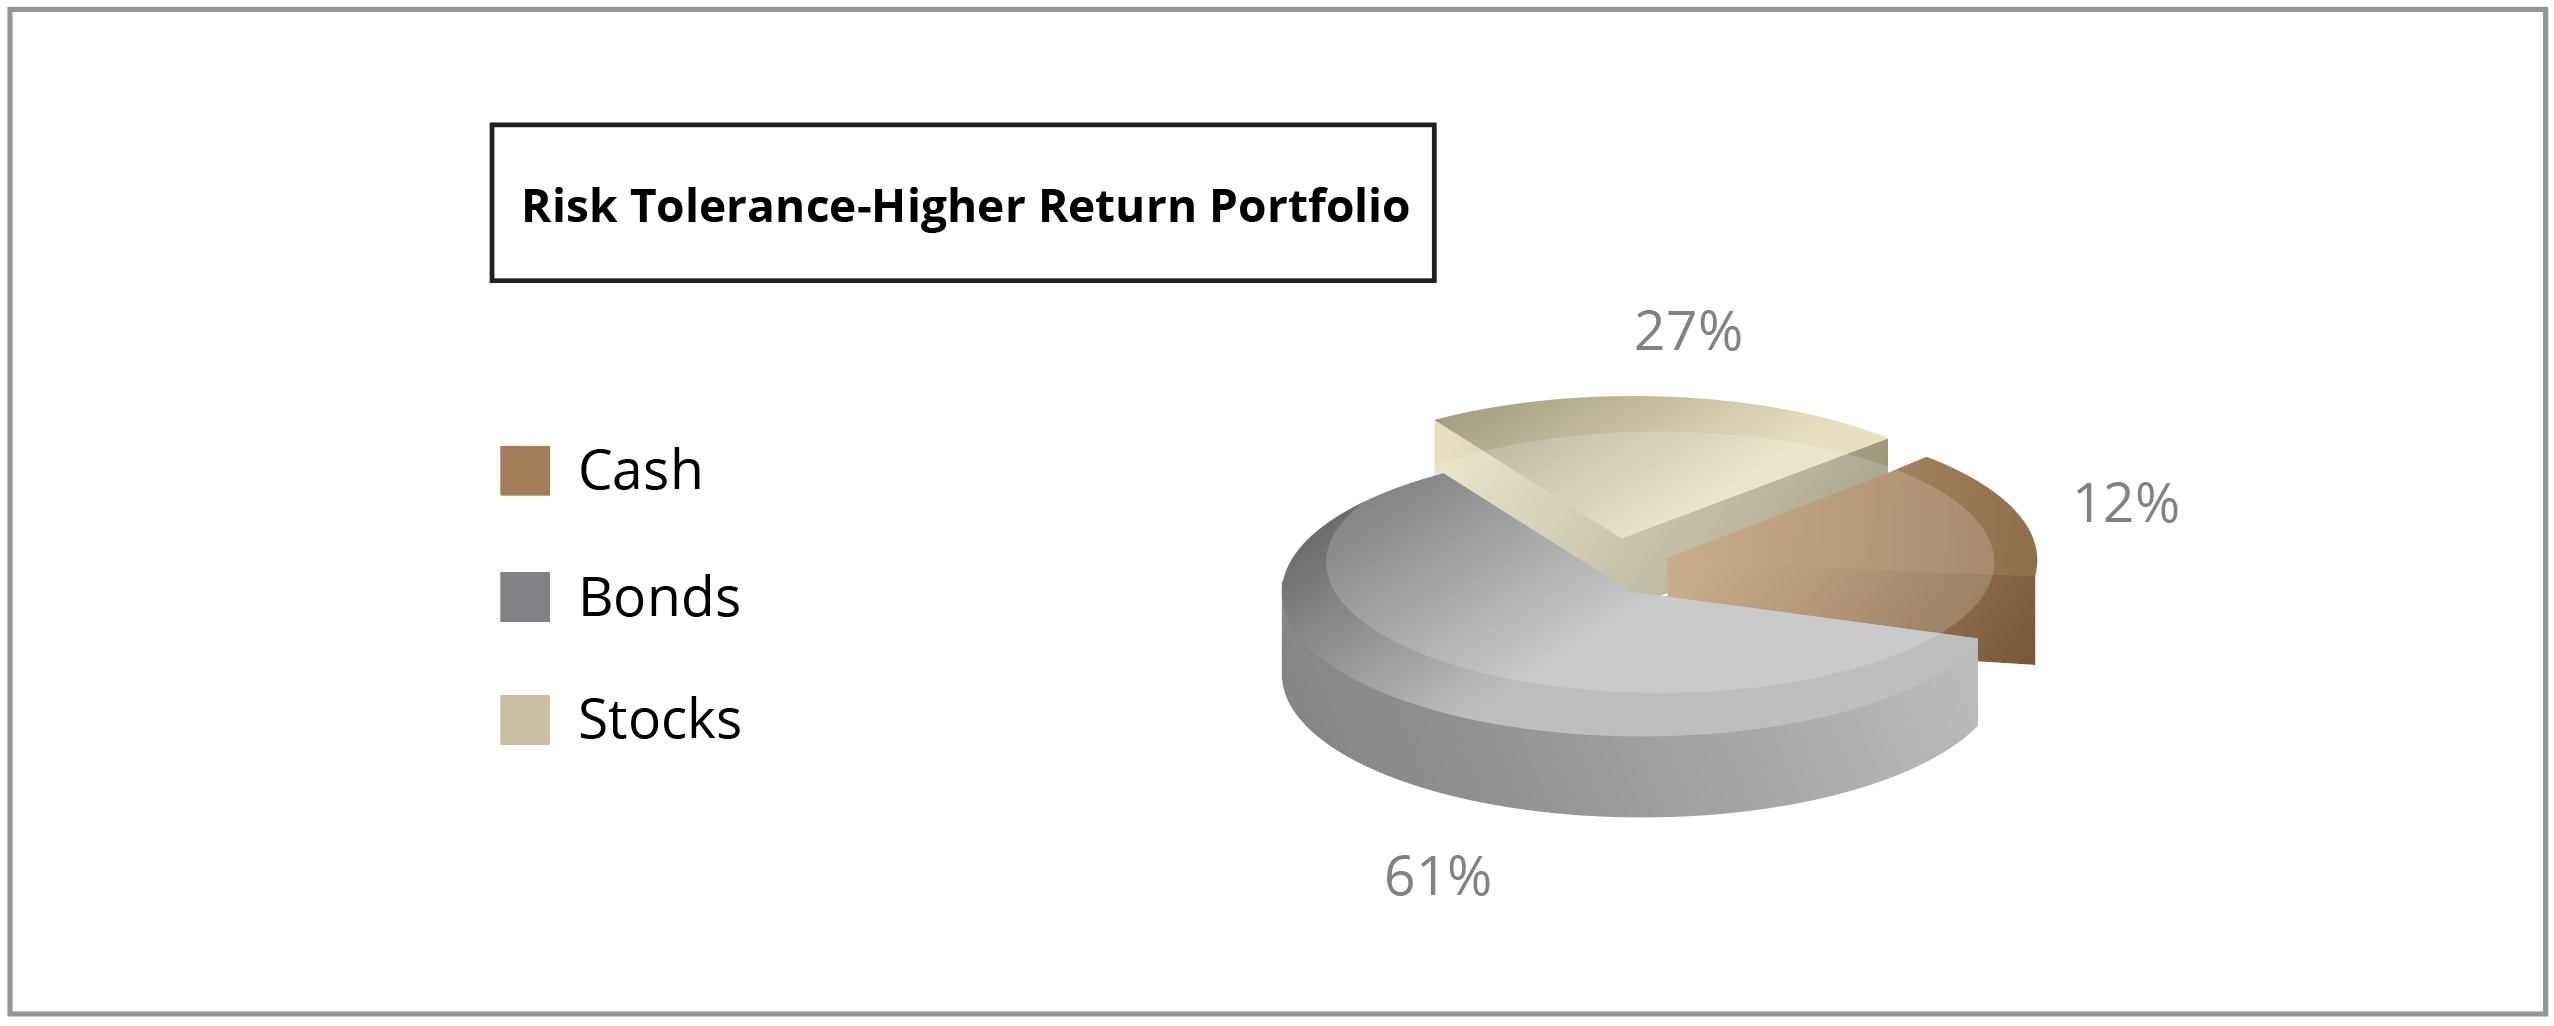
The image below illustrates the risk-and-return profiles of two hypothetical investment portfolios, during the period 1969-2010. The lower risk portfolio, had a lower proportion of stocks and bonds and a higher proportion of cash but assumed less risk than the higher return portfolio. Combining stocks, bonds, and cash can produce different risk-return trade-offs.
 |
 |
||||||||||
|
|
Source: StateTrust’s analysis of Morningstar data. Performance shown is not indicative of the performance of any specific investment. An investor cannot invest in an index, such as the one these graphs are based on. Past returns are no guarantee of future performance. These returns are based on historical information, from sources believed to be reliable, but accuracy cannot be guaranteed, and these returns can vary in future time periods.
Investment Risk Profile
Different investors react differently to risk. Here at StateTrust, we understand that each individual is concerned about varying risk factors. The table below shows you some of the components of investment risk.
| Components of Investment Risk | |
|---|---|
| Liquidity Risk | Enough cash to meet expenses? |
| Asset Allocation Risk | Are assets diversified* in the best possible way? |
| Board Room Risk | Can decisions makers hang on to long-term strategies in the face of an ever-changing market? |
| Lost Opportunity Risk | Investor deviates or waits too long to apply investment strategies. |
| Purchasing Power Risk | Will investment strategy keep pace with inflation? |
| Funding Risk | Will expected contributions be made? |
| Risk versus Return | Are returns consistent with the level of risk? |
* Diversification does not guarantee a profit or ensure against loss.
Diversification Benefits
By investing in a mix of asset classes such as stocks, bonds, and Treasury bills, StateTrust client advisors may insulate their client portfolios from major downswings in a single asset class. One of the main advantages of diversification* is that it makes the investments less dependent on the performance of any single asset class.
The graphic below shows that a diversified portfolio* experienced lower volatility than stocks or bonds alone.
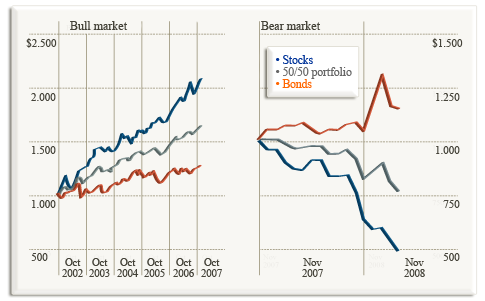
Source: StateTrust’s analysis of Morningstar data. Performance shown is not indicative of the performance of any specific investment. An investor cannot invest in an index, such as the one these graphs are based on. Past returns are no guarantee of future performance. These returns are based on historical information, from sources believed to be reliable, but accuracy cannot be guaranteed, and these returns can vary in future time periods.
* Diversification does not guarantee a profit or ensure against loss.
At StateTrust our advisors think globally at the moment of tailoring the best financial solutions and portfolios.
The image below shows the ranges of annual returns for Domestic, International, Europe and Pacific regional composites, over the period 1970 through 2010.
These annual ranges of returns provide an indication of the historical volatility (risk) and range of returns experienced by investments in various global markets.
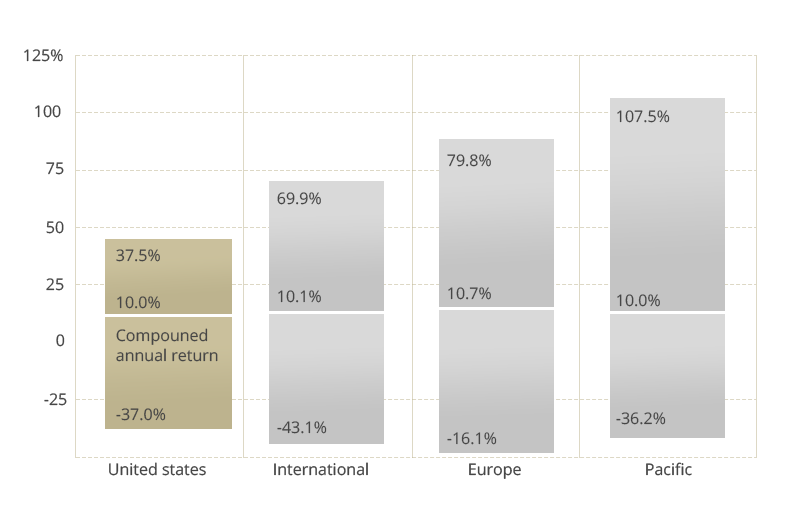
Source: StateTrust’s analysis of Morningstar data. Performance shown is not indicative of the performance of any specific investment. An investor cannot invest in an index, such as the one these graphs are based on. Past returns are no guarantee of future performance. These returns are based on historical information, from sources believed to be reliable, but accuracy cannot be guaranteed, and these returns can vary in future time periods.