Stocks are generally classified as Growth Stocks or Value Stocks (in some cases a third category for stocks that are a blend is also added). One way to classify stocks as growth or value is the following:
- Select all stocks.
- Calculate the price/earnings (P/E) ratio for each stock.
- Sort the stocks, with the highest P/E ratios at the top.
- Growth stocks are the top 50%.
- Value stocks are the bottom 50%.
The graphic below illustrates the results of such classification:
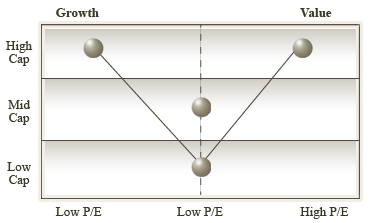
Valuation and Growth characteristics
Growth
Growth management attempts to identify companies with above-average growth possibilities. Growth investors analyze the price/earnings ratio of a stock, and are mostly concerned with earnings and future earnings growth.
There are two sub-styles:
- Consistent growth: Managers focusing on high-quality, consistently growing companies.
- Earnings momentum: Managers focusing on companies that offer above-average growth but with potentially high volatility.
Value
Value management considers the stock's current price as critical. When analyzing the P/E ratio, value investors are mostly interested in price relative to intrinsic value (as determined by future dividend streams).
There are three sub-styles:
- Low P/E: Investors who focus on low priced stock relative to current, normalized, or discounted future earnings. Some of these companies are in out-of-favor or cyclical industries.
- Contrarian: This value investor looks for companies whose stock is cheap relative to their tangible book value. Contrarians hope for a cyclical market change that will result in a turnaround for the stock.
- Yield: Yield investors are the most conservative and they focus on companies with above-average stock yields that are able to maintain or increase their dividend payments.
Impact of Growth Stocks vs. Value Stocks
Historically, value stocks have outperformed growth stocks. StateTrust takes into account this pattern at the moment of allocating assets. The following graph shows that, on average, the cumulative returns of value stocks outperformed those of growth stocks, one month, six months, one year, and three years after the end of a recession.
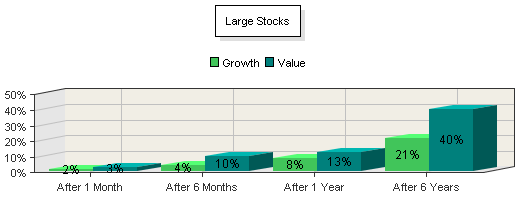
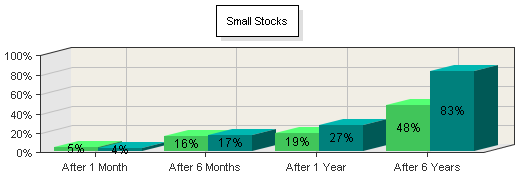
Source: StateTrust’s analysis of Morningstar data. Performance shown is not indicative of the performance of any specific investment. An investor cannot invest in an index, such as the one these graphs are based on. Past returns are no guarantee of future performance. These returns are based on historical information, from sources believed to be reliable, but accuracy cannot be guaranteed, and these returns can vary in future time periods.