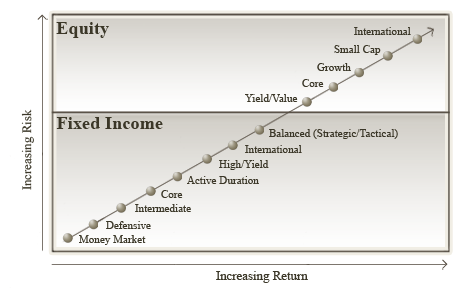
For both equity and fixed income styles, it is important to assess the risk return profiles very carefully.
Our client advisors have extensive training in portfolio allocation, investment style analysis and security diversification* in order to ensure that client portfolios are well structured. All client portfolios are reviewed to validate their effectiveness against market changes.
* Diversification does not guarantee a profit or ensure against loss.
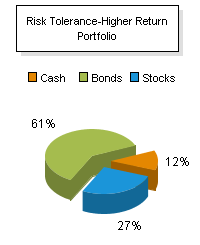
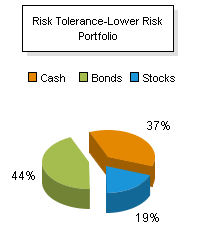
Potential to Reduce Risk Although it may appear counterintuitive, diversifying* a portfolio of fixed-income investments to include stocks reduced the overall volatility of a portfolio during the period 1969–2010. Because stocks, bonds, and cash generally do not react identically to the same economic or market stimuli, combining these assets can often produce a more appealing risk-return tradeoff. The following image illustrates the risk-and-return profiles of two hypothetical investment portfolios during the period 1969-2010. The lower risk portfolio had a lower return than the higher return portfolio, but assumed much less risk.
 |
 |
||||||||
|
|
Source: StateTrust’s analysis of Morningstar data. Performance shown is not indicative of the performance of any specific investment. An investor cannot invest in an index, such as the one these graphs are based on. Past returns are no guarantee of future performance. These returns are based on historical information, from sources believed to be reliable, but accuracy cannot be guaranteed, and these returns can vary in future time periods.